Credit Watch: Manifesto
Follow the Money. Understand the Economy.
A personal project by Abdurrahman Fadhil.
Visit bit.ly/CreditWatch for more info.
TL;DR
- Mainstream economics distracts the general public from knowing the real driver of the economy: the creation of money through credit.
- Money is created from nothing by banks when they make loans, and by central banks when they buy assets like government bonds. These actions create new purchasing power.
- Interest rates are a smokescreen. The true stance of monetary policy is the growth rate of money, not the policy rate set by the central bank.
- Track the cause, not the effect. Instead of traditional measures like M2 (bank deposits), we should measure the actions that create money. The proposed measure is: (1) bank credit to the private sector (loans to people and companies), plus (2) government debt held by banks and the central bank (monetized deficits).
- This project’s goal is to periodically track this new credit-based measure of money for Indonesia through a publicly available online dashboard. This will expose where money comes from and where it goes, equipping the public with clear, actionable insights and holding bankers and central bankers accountable for their actions.
Introduction
Mainstream economics is a mess. It teaches thousands of students fantastical concepts like price rigidity and the Phillips curve to explain inflation and monetary policy. These are distractions. The real driver of aggregate nominal spending—and therefore most macroeconomic outcomes—is the quantity of money, created, circulated, and destroyed through credit. Yet, it’s widely misunderstood, mismeasured, and ignored. Credit Watch aims to change that by focusing on the truth: money is debt, and tracking its creation reveals who truly controls the economy and dictates its trajectory.
Where Does Money Really Come From?
Money is debt. The vast majority of money in a modern economy is not physical cash but digital bank deposits, which are created when loans are made and destroyed when loans are repaid (McLeay et al., 2014a; 2014b). This process does not involve banks lending out pre-existing funds. Banks are not mere intermediaries; they are the primary creators of money.
To understand this, we can use simple T-account analysis, which shows the changes to an entity’s balance sheet. An entity’s assets (what it owns) must equal its liabilities plus equity (what it owes to others and to its owners).
Scenario 1: A Commercial Bank Grants a Loan
Imagine a company, PT Maju Jaya, needs a Rp 1 billion loan to purchase new equipment. It goes to Bank Rakyat Indonesia. When the bank approves the loan, the following happens simultaneously on their respective balance sheets:
Bank Rakyat Indonesia’s (Commercial Bank) Balance Sheet
| Assets | Liabilities |
|---|---|
| + Rp 1 Billion Loan to PT Maju Jaya | + Rp 1 Billion Deposit of PT Maju Jaya |
PT Maju Jaya’s (Non-Bank Entity) Balance Sheet
| Assets | Liabilities |
|---|---|
| + Rp 1 Billion Deposit at Bank Rakyat Indonesia | + Rp 1 Billion Loan from Bank Rakyat Indonesia |
Look closely. The bank did not take money from its vault or from another depositor. It created a new asset (the loan) and a corresponding new liability (the deposit) with a few keystrokes. That Rp 1 billion deposit is new money. It can now be spent by PT Maju Jaya, adding to the total purchasing power in the economy. Money was created “out of thin air,” backed not by reserves, but by the promise of future repayment from the borrower.
Scenario 2: The Central Bank Buys Government Bonds (Quantitative Easing)
Now, consider how government financing becomes money. The central bank, Bank Indonesia (BI), can purchase a government bond from a non-bank entity, like a pension fund. This is how quantitative easing (QE) or debt monetization works.
Suppose BI buys a Rp 5 trillion government bond from PT Sumber Rezeki, which holds its account at a commercial bank (e.g., Bank Mandiri).
Bank Indonesia’s (Central Bank) Balance Sheet
| Assets | Liabilities |
|---|---|
| + Rp 5 Trillion Government Bond | + Rp 5 Trillion Reserves of Bank Mandiri |
Bank Mandiri’s (Commercial Bank) Balance Sheet
| Assets | Liabilities |
|---|---|
| + Rp 5 Trillion Reserves of Bank Mandiri | + Rp 5 Trillion Deposit of PT Sumber Rezeki |
PT Sumber Rezeki’s (Non-Bank Entity) Balance Sheet
| Assets | Liabilities |
|---|---|
| + Rp 5 Trillion Deposit at Bank Mandiri | No change |
| - Rp 5 Trillion Government Bond |
The central bank pays for the bond by crediting Bank Mandiri’s reserve account. In turn, Bank Mandiri credits PT Sumber Rezeki’s deposit account. The end result is that PT Sumber Rezeki has swapped a less liquid asset (a bond) for a perfectly liquid one (a bank deposit). This Rp 5 trillion deposit is new money added to the broad money supply. This is how government spending, when financed by the central bank, directly injects new purchasing power into the economy.
Scenario 3: A Commercial Bank Buys Government Bonds
The same principle applies when commercial banks purchase government bonds from non-bank private entities, as they also create new money in the process by crediting the bond seller with the bank’s deposit. Suppose Bank Negara Indonesia purchases a Rp 1 billion government bond from PT Sukses Makmur.
Bank Negara Indonesia’s (Commercial Bank) Balance Sheet
| Assets | Liabilities |
|---|---|
| + Rp 1 Billion Government Bond | + Rp 1 Billion Deposit of PT Sukses Makmur |
PT Sukses Makmur’s (Non-Bank Entity) Balance Sheet
| Assets | Liabilities |
|---|---|
| + Rp 1 Billion Deposits of Bank Negara Indonesia | No change |
| - Rp 1 Billion Government Bond |
The bank pays for the bond by crediting the seller (i.e., PT Sukses Makmur) with a Rp 1 billion deposit. That Rp 1 billion deposit is new money, created “out of thin air” by Bank Negara Indonesia. The government budget deficit, which previously was financed by the private sector’s savings, is now financed by the commercial bank through money creation.
The Truth About Monetary Policy
Interest rates are a smokescreen. The T-account analysis shows banks lend first and worry about reserves later. The central bank’s key policy tool is not the price of reserves (the policy rate), but its influence over the quantity of credit created. They act as the ultimate guarantor of the banking cartel, ensuring the system remains liquid and stable, thereby enabling banks to continue creating money.
The central bank’s policy rate only indirectly influences the expected profitability of lending, rather than directly controlling the supply of money. Banks are not reserve-constrained; they can always obtain reserves from the central bank if they need them to settle interbank payments or meet reserve requirements. The true stance of monetary policy is not the BI 7-Day Reverse Repo Rate; it is the rate of growth of credit. A central bank that truly aims to control inflation must manage the aggregate growth of credit, not merely tinker with interest rates at the margin.
The narrative that central banks control inflation by adjusting the nominal interest rate is completely absurd. Interest rates are an effect of inflation, not the cause. A tight monetary policy, characterized by slow money growth, leads to lower inflation and interest rates. Conversely, an easy policy through rapid money growth results in higher inflation and interest rates. This is why focusing on interest rates is a misleading way to assess the stance of monetary policy. The true indicator of monetary policy is the rate of change in the quantity of money (Friedman, 1968). Bankers and central bankers, however, would like to keep the general public clueless about this, because otherwise they wouldn’t be able to create money whenever they want for whoever they like.
A New Measure of Money
Traditional macroeconomic practice concentrates on the liability side of the banking sector’s balance sheet—M1, M2, etc. These are measures of the stock of liquid assets after they have been created. They are the effect. Credit Watch proposes a new measure that focuses on the asset side of the banking system—on the acts of credit creation themselves. This is the cause.
This credit-centric view cuts through the noise by tracking the transactions that create money, revealing who is receiving purchasing power and for what purpose. My proposed measure is:
Money = Commercial banks credit to non-bank entities + Government debt securities owned by commercial banks and the central bank
These two variables are chosen because they represent the two fundamental channels through which new money is created and injected into the domestic economy.
Banking Sector Credit to the Non-Bank Private Sector: This is the primary engine of economic activity. It captures all loans extended to households and firms. When you track this component, you are tracking the creation of money that fuels private consumption, business investment, and asset purchases. It is the most direct measure of the private sector’s ability to increase its spending. An acceleration in this credit flow is a leading indicator of a future increase in nominal GDP (Werner, 2005).
Government Debt Owned by Banks and the Central Bank: This component is critical for fiscal and monetary analysis. It isolates the portion of government spending that is financed through money creation, as opposed to being financed by taxes or tapping into the existing pool of savings from the non-bank public. When commercial banks and the central bank purchase government debt, it creates new deposits in the process, as shown in the T-account analysis. This is a pure injection of new purchasing power that allows the government to command real resources without first removing them from the private sector.
By summing these two components, we get a comprehensive picture of the total flow of newly created credit—and therefore money—into the economy, directed at both the private and public sectors. While data limitations may initially constrain the scope, in the Indonesian context, these two components represent the lion’s share of money creation and provide a powerful, actionable starting point.
What I’m Doing
Credit Watch is a personal project to raise public awareness and hold bankers, central bankers, and policymakers alike accountable through a publicly available online dashboard.
A public, user-friendly tool to track and visualize historical data. This dashboard will democratize access to critical economic data, making complex monetary concepts accessible to a broader audience.
Displays my credit-based money measure alongside macroeconomic indicators. Users will be able to interact with the data, observe trends, and draw their own conclusions about the relationship between credit and economic performance.
Built with Google Sheets for accessibility. This ensures ease of access and widespread usability, removing technical barriers for engagement. Visit bit.ly/CreditWatch to access the dashboard.
Proposed Indicators
Credit Watch proposes a range of indicators, primarily sourced from Statistik Ekonomi dan Keuangan Indonesia (SEKI) from Bank Indonesia, along with data from the Bank of International Settlements (BIS), Survey Harga Properti Residensial (SHPR), and Direktorat Jendral Pembiayaan dan Pengelolaan Risiko (DJPPR) Kementrian Keuangan Republik Indonesia. All indicators are measured in billions of Rupiah unless otherwise specified.
Credit-Centric Monetary Aggregate
The core measure is MONEY, the Credit-Centric Money Stock, which represents the total quantity of money created by the domestic banking system, calculated as the sum of PRIVATE and PUBLIC components.
PRIVATE is the Credit to the Private Sector, representing total outstanding loans from commercial banks to households and corporations (from SEKI 1.5). This is further broken down into:
FIRMS: Bank loans to non-bank firms for investment and working capital, which is further disaggregated into:FINANCIAL: Bank loans to non-bank financial institutions. This includes the insurance, real estate, and business services sector—companies that shuffle papers and existing assets rather than creating real value to the economy.REAL: Bank loans specifically to private non-financial sector firms. These firms often use credit to finance investments in real capital to help produce more goods and services.
HOUSEHOLD: Bank loans to households for all purposes, which is further disaggregated into:PROPERTY: Household Property Credit, covering bank loans for mortgages (KPR), apartments (KPA), and office houses.CONSUMPTION: Other Consumption Credit, including bank loans for vehicle purchases (KKB), unsecured personal loans (KTA), credit card debt, etc.
PUBLIC represents Credit to the Public Sector, sourced from Direktorat Jendral Pembiayaan dan Pengelolaan Risiko (DJPPR) Kementrian Keuangan Republik Indonesia. Specifically, tradable government debt securities (SBN) held by the banking system (commercial banks and the central bank), indicating government spending funded by money creation. This includes:
QE: Quantitative Easing, defined as government debt securities (SBN) purchased and held on Bank Indonesia’s balance sheet, representing the central bank’s direct intervention in the economy.BANKPUBLICDEBT: Bank-Financed Fiscal Deficit, referring to government debt securities (SBN) purchased and held by commercial banks.
Key Macroeconomic Indicators
To place these credit flows in context, several key macroeconomic indicators are also tracked:
NGDP: Nominal Gross Domestic Product, the market value of all final goods and services (from SEKI 7.1). This equals the aggregate nominal income.CPI: Consumer Price Index, measures the prices paid by typical urban consumers (Index 2010=100, from SEKI 8.1 and BIS).HPI: House Price Index, a measure of price changes in residential properties in major cities (Index 2018=100, from SHPR and BIS).PUBLICDEBT: The total outstanding tradable government debt securities (SBN). Measures the amount of money the government borrows to finance its spending irrespective of its lender.
Derived Indicators
From these base variables, several derived indicators are calculated to assess the economic stance. All growth rates are year-on-year (YoY) percentage changes, calculated as .
MONEYGROWTH: Money Growth, the annual percentage change in the money stock (MONEY). This is the primary indicator of the overall monetary policy stance.PRIVATEGROWTH: Credit to the Private Sector Growth, the annual percentage change in bank credit to the non-bank private sector, which is highly correlated with inflation and economic growth.PUBLICGROWTH: Credit to the Public Sector Growth, The annual percentage change in government debt held by the banking system. This is the primary indicator of inflationary threats of fiscal policy.GROWTH: Nominal GDP Growth, the annual change in NGDP. The primary indicator of economic growth.INFLATION: Consumer Price Inflation, the annual change in the CPI.HPIGROWTH: House Price Growth, the annual change in the HPI.PROPERTYGROWTH: Household Property Credit Growth, the annual percentage change in the bank loans for household property credit, highly correlated with house price growth.
Finally, two key ratios provide insight into the nature of credit creation and fiscal financing:
PRODUCTIVE: Credit for Productive Purposes, the proportion of money created for the non-financial sector relative to the total money supply, calculated as the ratio of REAL to MONEY.MONETIZEDDEFICIT: Monetized Deficit, the proportion of the government’s debt that is financed by printing money, calculated as the ratio of PUBLIC to PUBLICDEBT.
Current Progress
I have collected the data and uploaded them into Google Sheets. You can access the data at bit.ly/CreditWatch. As of May 2025, Total Credit-Centric Money Stock (MONEY) stands at Rp 9,726 trillion (Figure 1). To put this into perspective, Indonesia’s nominal GDP for 2024 is Rp Rp22,138 trillion, so the money stock is roughly 44% of the economy’s annual output.
MONEY = PUBLIC + PRIVATE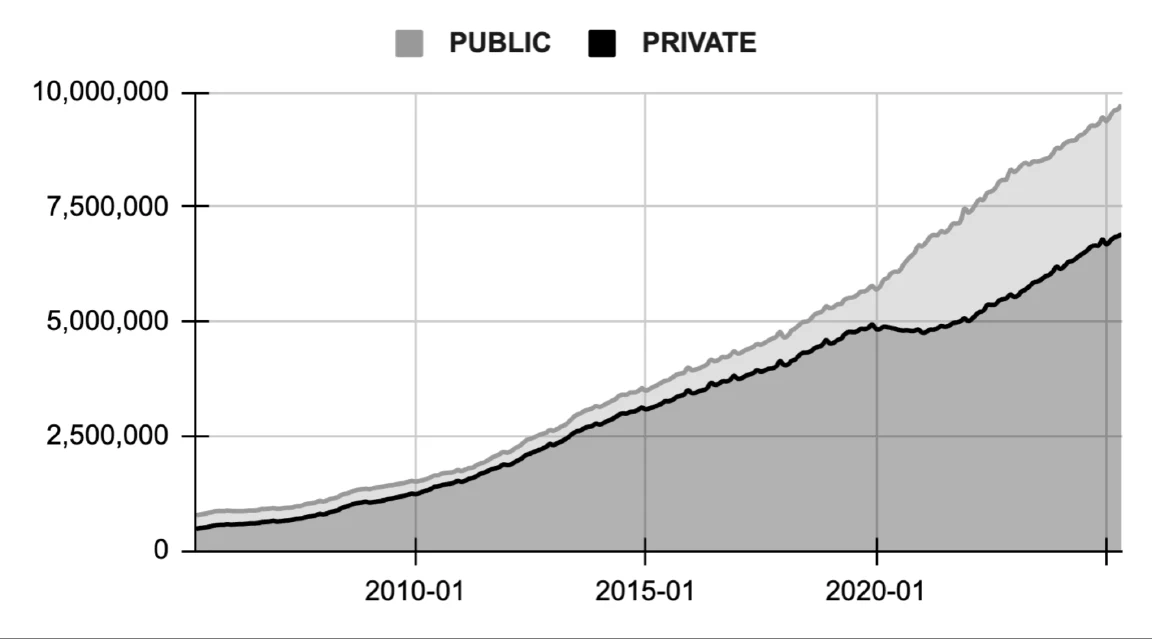
The largest component is Credit to the Private Sector (PRIVATE) at Rp 6,913 trillion (about 71% of total money). This signifies that private sector borrowing for consumption and investment remains the dominant source of money creation in Indonesia.
The remaining portion comes from Credit to the Public Sector (PUBLIC) at Rp 2,813 trillion (around 29% of total money). This indicates a significant reliance on the banking system, including the central bank, to finance government operations.
PRIVATE = HOUSEHOLD + FIRMS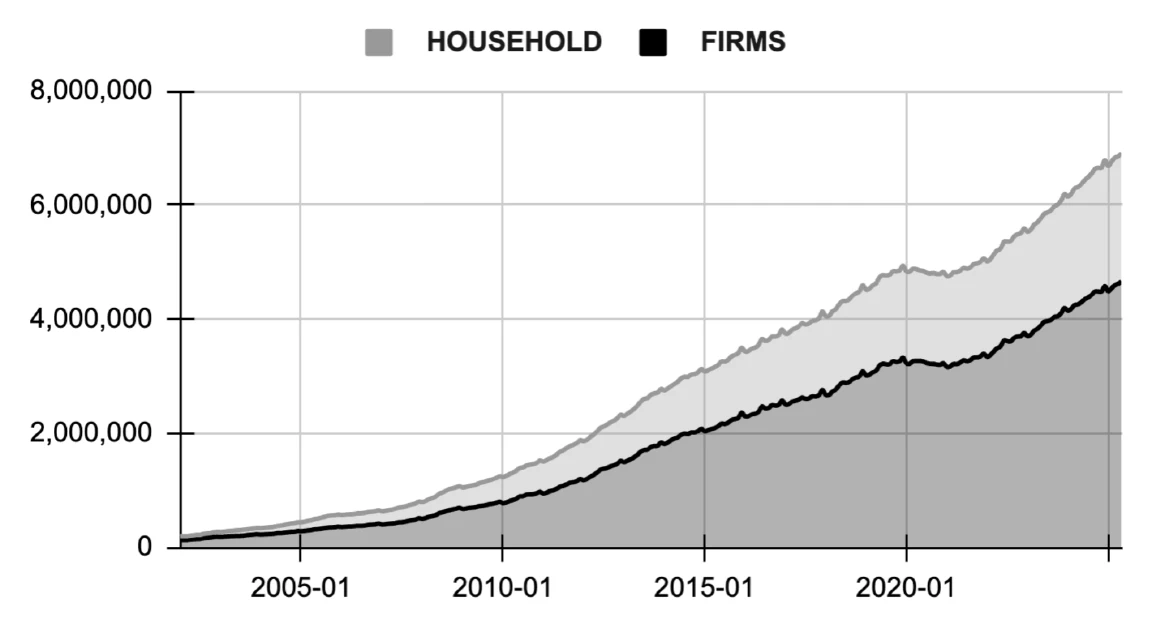
Looking closer at PRIVATE credit (Figure 2), Household Credit (HOUSEHOLD) accounts for Rp 2,250 trillion, roughly one-third of private credit. This includes loans for consumption and property acquisitions. Firms Credit (FIRMS) makes up the larger share at Rp 4,662 trillion. Businesses are borrowing more than households.
Diving into HOUSEHOLD credit (Figure 3), Property Credit (PROPERTY) is Rp 807,133 billion, representing about 36% of household loans. This shows a notable portion of household borrowing is directed towards real estate.
Other Consumption Credit (CONSUMPTION) is higher at Rp 1,443 trillion, or approximately 64% of household loans, suggesting that general consumption and other personal financing needs drive the majority of household credit creation.
HOUSEHOLD = PROPERTY + CONSUMPTION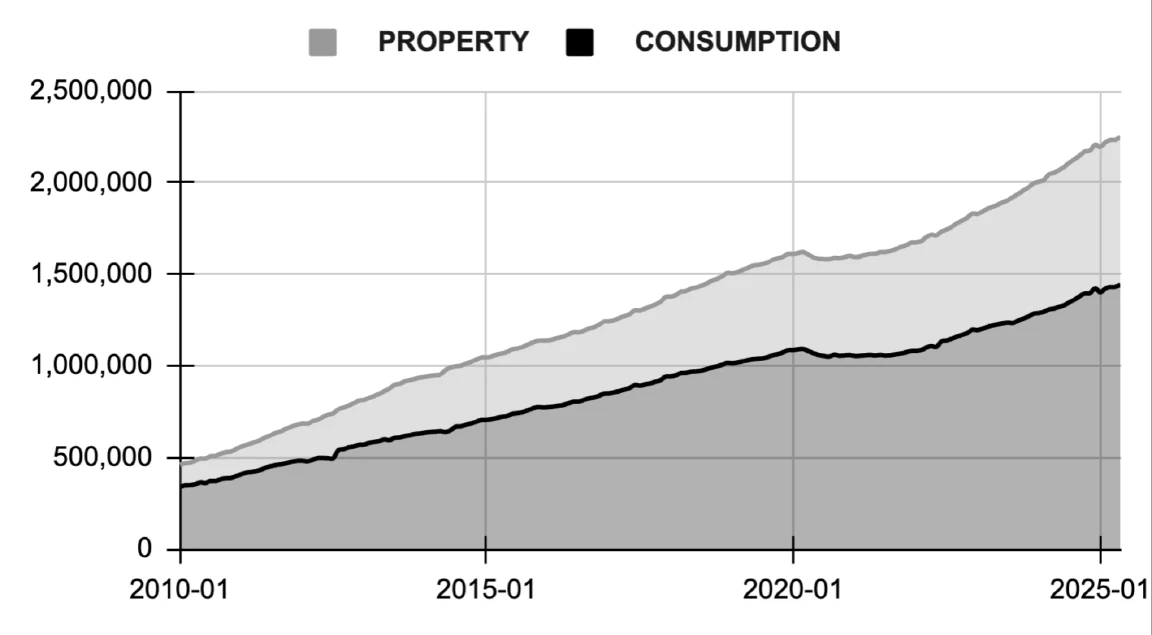
FIRMS = FINANCIAL + REAL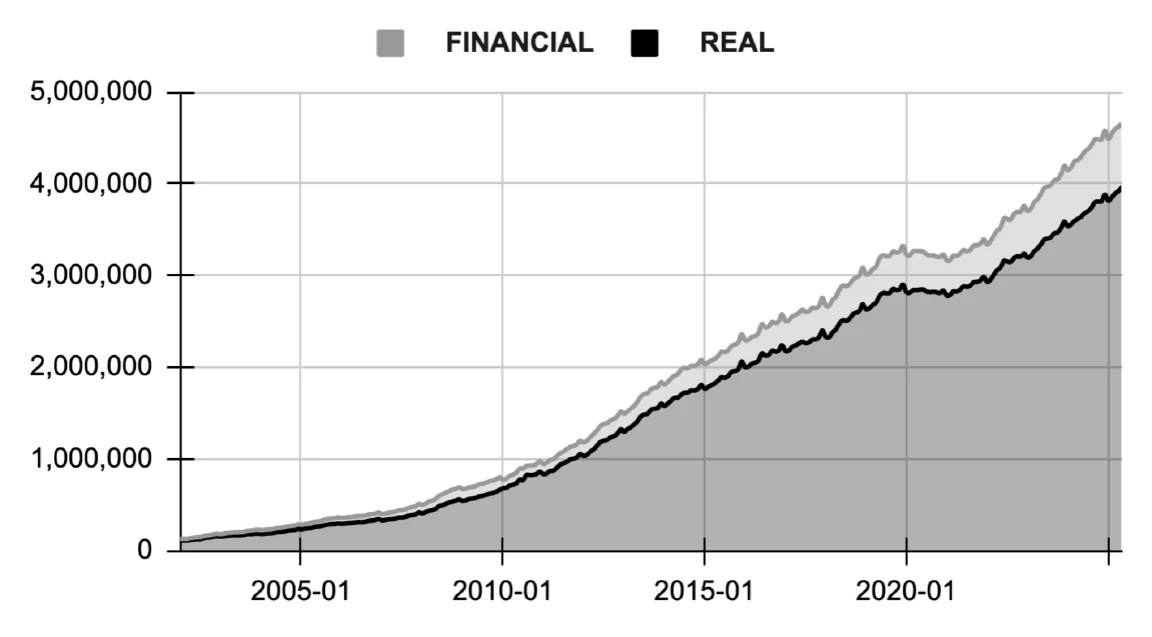
Examining FIRMS credit (Figure 4), Credit to the Financial Sector (FINANCIAL) is Rp 702,981 billion, about 15% of firm credit. This is money lent to entities that primarily deal with financial assets. Credit to the Real Sector (REAL) is significantly larger at Rp 3,959 trillion, comprising about 85% of firm credit. This is a positive sign, as it indicates that the vast majority of business borrowing is going towards activities that contribute directly to the production of goods and services, which is generally more productive for the economy.
PUBLIC = QE + BANKPUBLICDEBT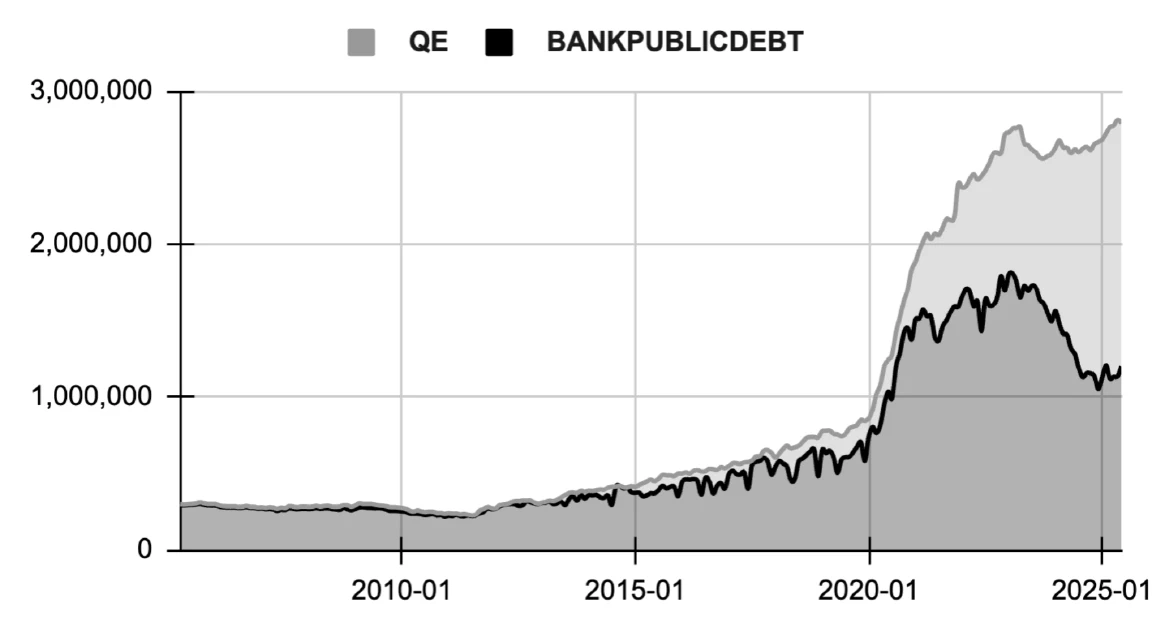
For PUBLIC credit (Figure 5), Quantitative Easing (QE) by Bank Indonesia stands at Rp 1,678 trillion. This means over half of the government debt held by the banking system is directly on Bank Indonesia’s balance sheet, a clear indication of direct monetary financing by the central bank.
Bank-Financed Fiscal Deficit (BANKPUBLICDEBT) by commercial banks is Rp 1,135 trillion. Commercial banks also play a substantial role in financing the government through new money creation.
MONEYGROWTH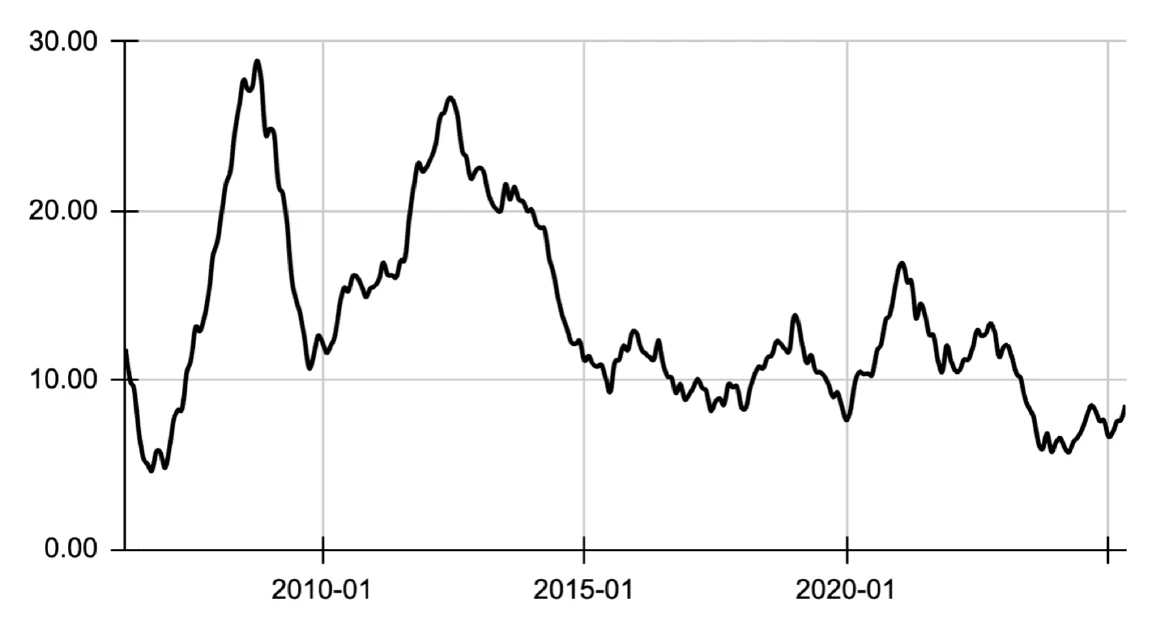
MONEYGROWTH (Annual change in Money Stock, Figure 6) is recorded at 8.53% as of May 2025. This relatively robust growth rate suggests a significant expansion of the money supply, indicating an accommodative monetary environment. For context, Indonesia’s inflation rate in May 2025 was 1.6% (YoY), and the Q1 2025 nominal GDP growth was 7.14% (YoY). This suggests that money growth is outpacing both consumer price inflation and nominal GDP growth, which could imply future inflationary pressures if sustained.
PUBLICGROWTH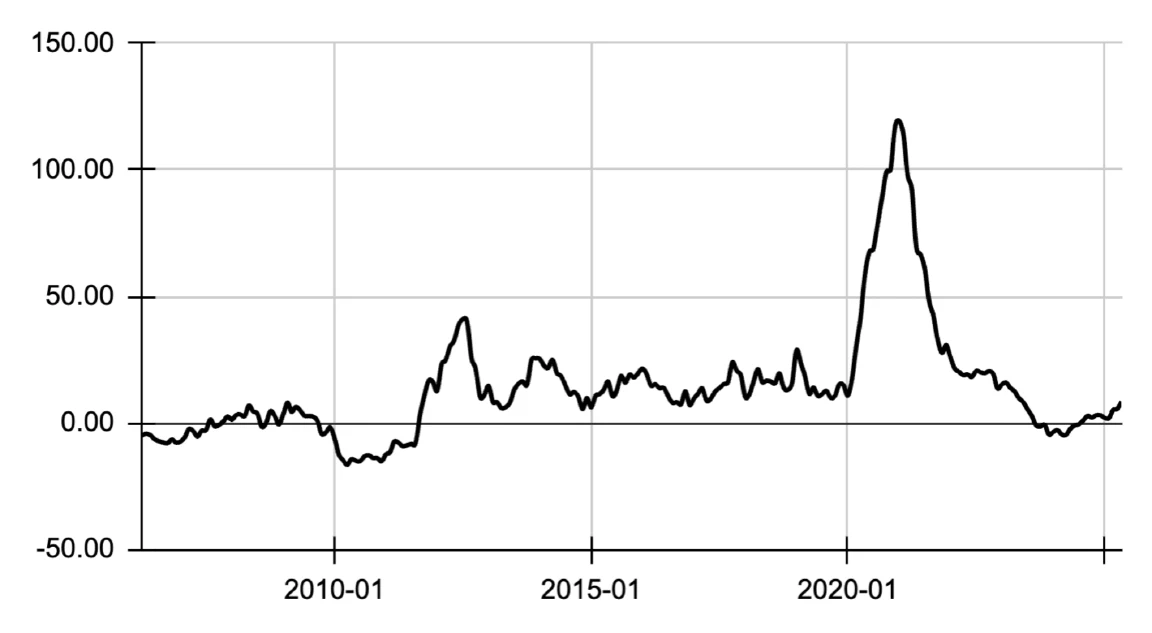
PUBLICGROWTH (Annual change in Public Sector Credit, Figure 7) was 6.61% as of June 2025. This indicates that the government’s reliance on money creation for financing has continued to grow, albeit at a slightly slower pace than overall money growth.
PRIVATEGROWTH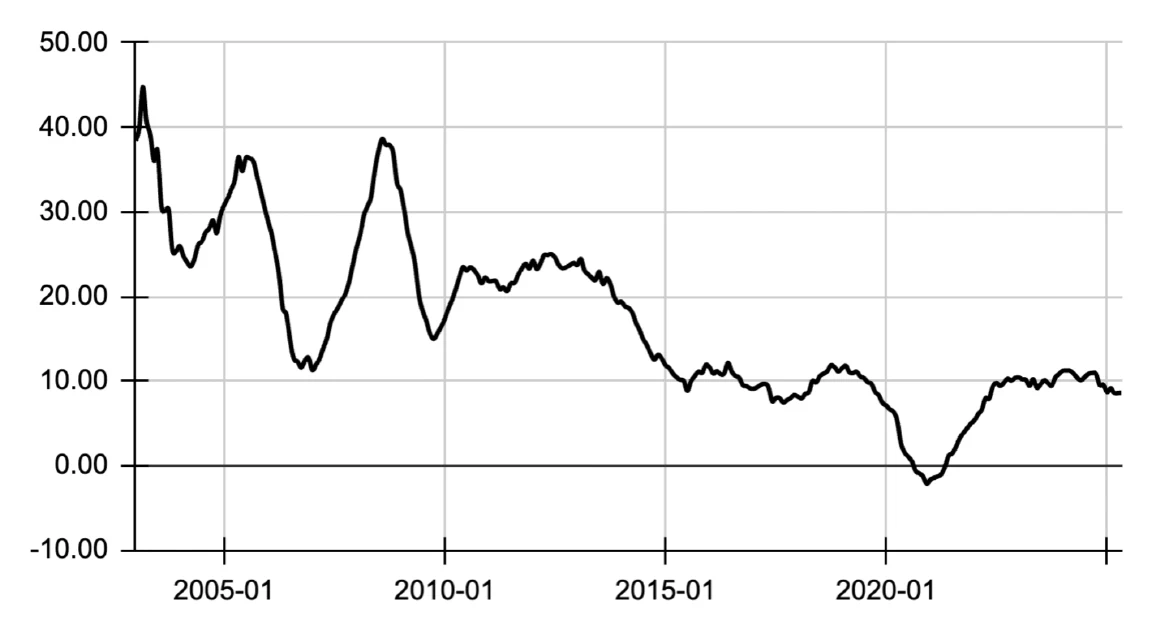
PRIVATEGROWTH (Annual change in Private Sector Credit, Figure 8) was 8.60% as of May 2025. This shows healthy growth in credit to the private sector, surpassing overall money growth and indicating strong demand for loans from households and businesses. This might be a good sign for economic activity but could also contribute to inflation if it outstrips the economy’s productive capacity.
MONETIZEDDEFICIT (Proportion of government debt financed by money creation, Figure 9) was 54.82% as of June 2025. This is a substantial figure, indicating that over half of Indonesia’s government debt is being financed by new money created by the banking system (both commercial banks and the central bank). This has significant implications for fiscal sustainability and potential inflationary risks, as it directly injects purchasing power into the economy without drawing from existing savings.
MONETIZEDDEFICIT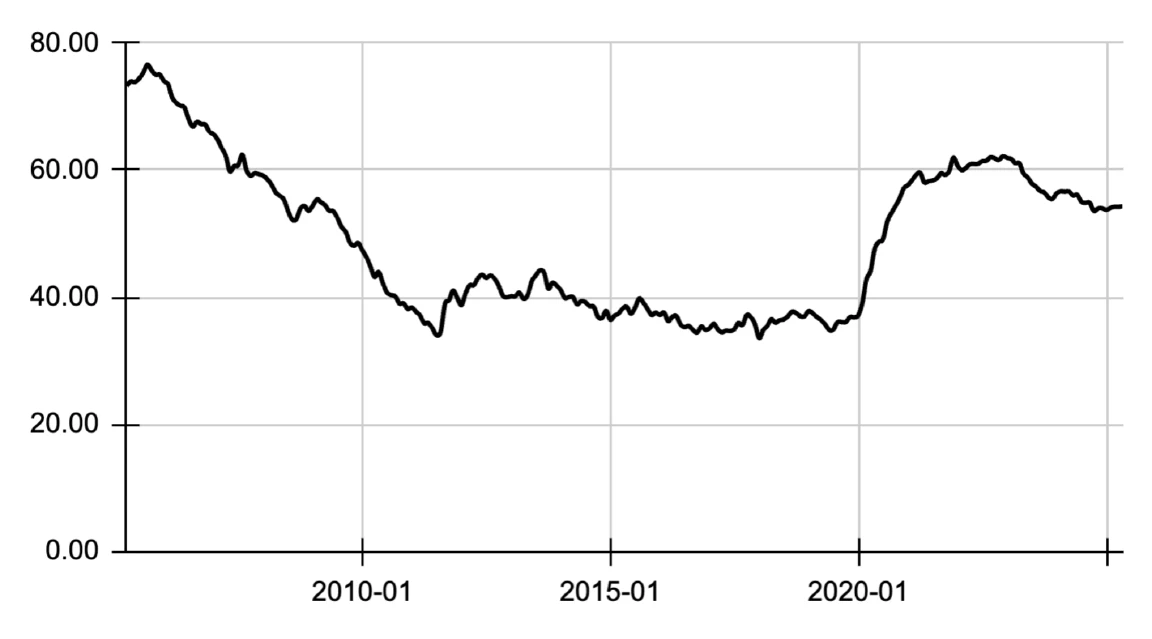
PRODUCTIVE (Proportion of credit for productive purposes, Figure 10) is 40.71% as of May 2025. This means that about 40% of the total new money created by the banking sector (considering credit to the real sector of firms relative to total money supply) is flowing into productive, real economic activities. While a decent portion, it also highlights that a considerable amount (the remaining 59.29%) is directed towards financial activities, household consumption, and government financing, which tend to favor inflation over real economic growth.
PRODUCTIVE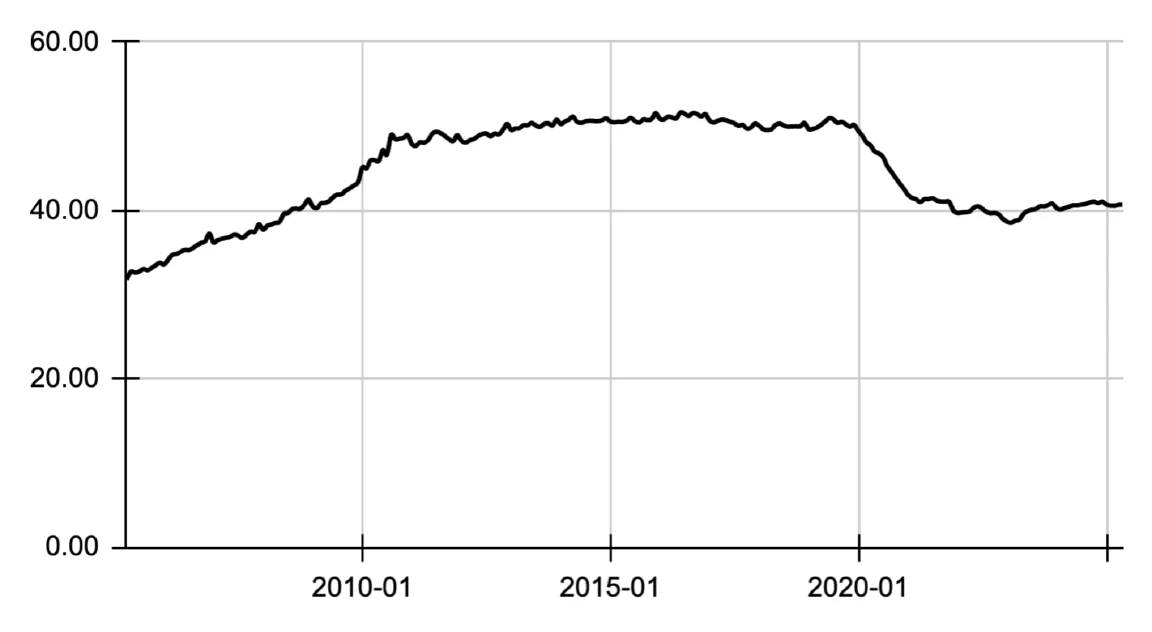
Finally, PROPERTYGROWTH (Household Property Credit Growth) was 7.96% as of June 2025. Meanwhile, HPIGROWTH (House Price Growth) was 1.08%, suggesting a robust housing supply that largely offset the price increase stemming from rising demand.
Why It Matters
By tracking credit, I reveal the hidden forces shaping the economy. No more blindly trusting central banks or accepting academic jargon that obfuscates rather than clarifies. Credit Watch equips the public with clear, actionable insights to understand money, challenge power, and demand accountability. This project is more than just an economic analysis; it is a call to intellectual arms, urging a return to fundamental economic principles and a rejection of the misleading narratives that dominate public discourse. By understanding where money truly comes from, we can better understand inflation, economic cycles, and the distribution of wealth, ultimately fostering a more equitable and transparent economic system.
Inspirations
- McLeay, M., Radia, A., & Thomas, R. (2014a). Money in the modern economy: an introduction. Bank of England Quarterly Bulletin, Q1.
- McLeay, M., Radia, A., & Thomas, R. (2014b). Money creation in the modern economy. Bank of England Quarterly Bulletin, Q1.
- Friedman, M. (1968). The role of monetary policy. American Economic Review, 58(1), 1-17.
- Werner, R. (2005). New paradigm in macroeconomics: Solving the riddle of Japanese macroeconomic performance. Palgrave Macmillan.
Tags: Economics